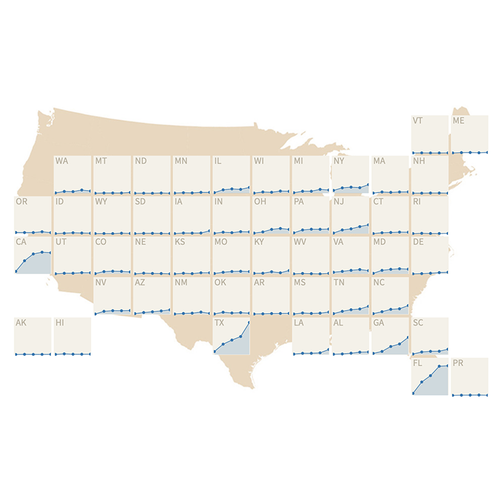
This data visualization maps new patterns of medical identity theft hot spots and activity in the US. The map shows how medical identity theft-related complaints have grown over time, and where they grow the most and least.
The complaint information is has mapped two ways:
Count of Reports
First, the data is visualized by simple count, called Count of Reports. Simple count shows the number of total complaints in each state. A simple count number will reflect the influence of large population centers. For example, simple counts of consumer complaints typically show more complaints coming from highly populous areas such as California, New York, and Texas. This does not always mean the actual rate of medical identity theft is higher in those locations. It usually means there are overall higher volumes of cases in those areas with higher populations.
Rate per 1 million analysis
Second, the data is visualized by rate per 1 million. Rate per 1 million allows a view of the data that is not skewed by population size. Therefore, the data will not automatically show the large cities as the hotspots of medical identity theft by virtue of sheer population volume. Instead, the data shows where the hotspots are occurring across all population sizes by rate of incidence.
The data visualizations include overviews of combined years, as well as year-by-year analysis.
Data visualization: John Emerson

